

How to Analyze Retention Rates in Recovery Programs
Retention rates are critical for understanding how well recovery programs engage participants and improve outcomes. Programs with higher retention rates often lead to better recovery success, reduced substance use, and improved life stability. However, many programs struggle with high dropout rates, especially within the first 30 days.
Key takeaways from this guide:
- Retention rates measure program effectiveness: Longer stays in treatment (90+ days) strongly correlate with better outcomes, such as reduced substance use and fewer legal issues.
- Dropout challenges: Up to 80% of participants disengage, with the highest drop-off occurring within the first 30 days.
- Tracking retention: Use the formula
(Active Participants at Target Date / Total Enrolled) × 100to calculate retention rates. Tools like Recovery Center CRM simplify this process. - Improvement strategies: Address high-risk dropout points by reducing wait times, offering same-day assessments, and implementing automated follow-ups.
Retention analysis helps identify when and why participants leave, allowing programs to refine their approach and support long-term recovery success.
Recovery Program Retention Statistics and Drop-Off Points
Why Retention Rates Matter in Recovery Programs
Retention as a Measure of Program Effectiveness
Retention rates are a key indicator of whether participants stay engaged long enough to benefit fully from therapeutic interventions. The American Society of Addiction Medicine (ASAM) highlights that early engagement and longer stays in treatment strongly correlate with better clinical outcomes. When participants remain in a program, it suggests that the therapeutic relationship is working and that the program is effectively addressing their needs during their recovery journey.
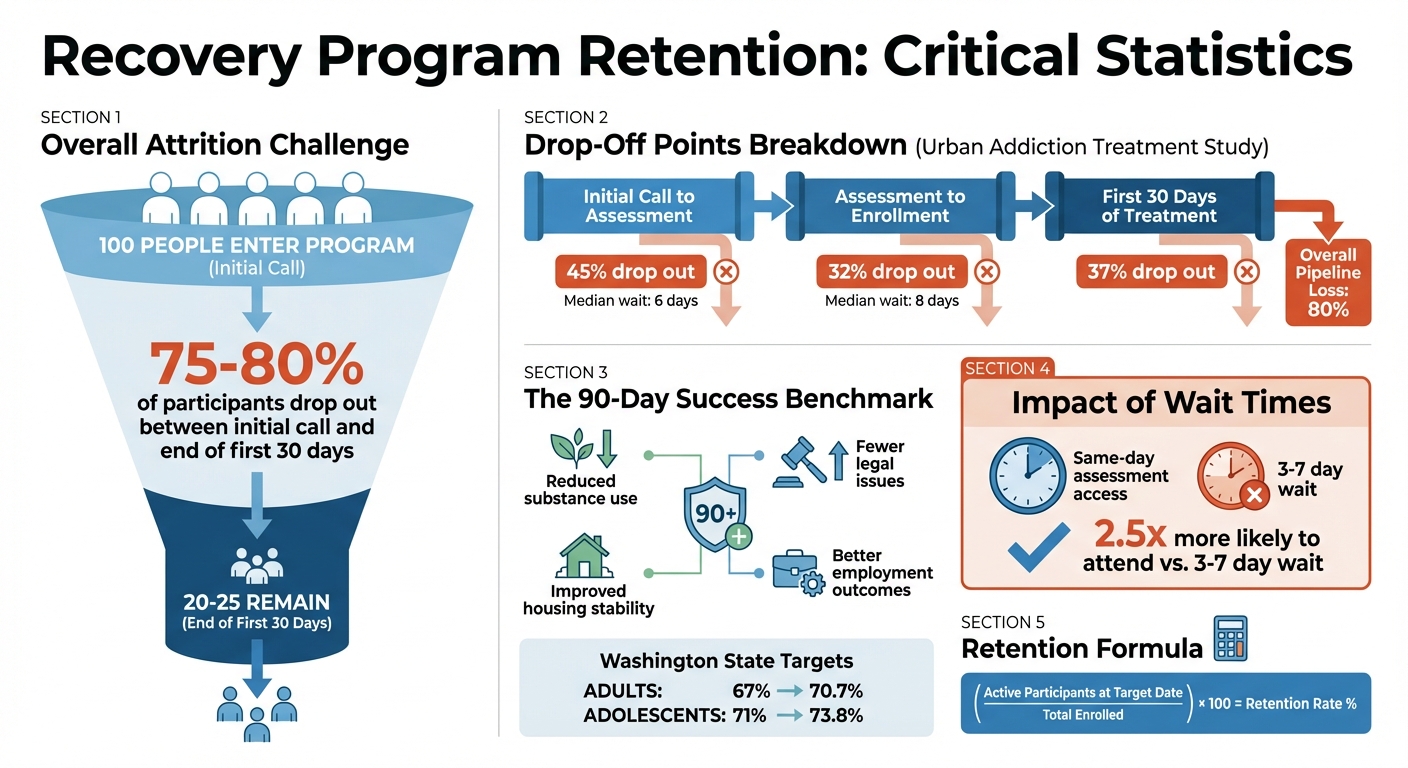
On the flip side, high dropout rates often point to systemic issues, such as lengthy wait times or rigid program requirements. For example, Urban Addiction Treatment in Peoria, Illinois, tracked 1,822 individuals and reported an overall attrition rate of 80%. Of these, 45% dropped out between the initial call and assessment, while 37% of those who enrolled left before completing 30 days. The median wait time for an assessment was six days. These figures highlight where participants are most likely to disengage, offering valuable insights into program weaknesses.
Retention also plays a critical role in safety. The risk of mortality rises sharply after discharge, and repeated transitions in and out of treatment significantly increase the likelihood of overdose. By keeping participants engaged, programs provide a safer environment during the stabilization phase, reducing these risks.
These metrics not only measure program performance but also emphasize how retention directly impacts recovery outcomes and participant safety.
Connection Between Retention and Long-Term Outcomes
Retention isn’t just about keeping people in the program - it’s about setting the foundation for lasting recovery. While early dropouts signal immediate challenges, sustained participation is essential for long-term success.
The 90-day mark is particularly significant. Research from the University of Washington Addictions, Drug & Alcohol Institute shows that staying in treatment for at least 90 days leads to measurable improvements, such as reduced substance use and lower involvement with the criminal justice system. This timeframe allows clinical interventions to stabilize participants both physically and mentally, giving them a stronger footing for recovery.
Beyond reducing substance use and legal issues, a 90-day duration often brings broader life improvements, including better housing stability, financial health, and employment outcomes. Recognizing this, Washington State's Division of Behavioral Health and Recovery set specific goals in 2017 to boost 90-day retention rates - from 67% to 70.7% for adult outpatient programs and from 71% to 73.8% for adolescent programs. These benchmarks highlight how retention is not just a clinical measure but also a reflection of improved quality of life for participants.
Retention, therefore, serves as both a short-term safety net and a long-term pathway to meaningful recovery and stability.
sbb-itb-ce23a48
How to Calculate Retention Rates Step-by-Step
Defining 'Active in Treatment'
Before diving into retention calculations, it’s crucial to define what "active" means in your program. For outpatient programs, the NIATx guidelines consider a participant "active" if they complete four treatment episodes (individual or group counseling) on four separate days within the first 30 days of enrollment. Meanwhile, in residential programs, participants are deemed active if they complete 30 continuous days of treatment and remain enrolled through day 30.
State-funded programs often include additional administrative rules. For example, the Illinois Division of Alcohol and Substance Abuse (DASA) ends an outpatient episode if there is no billable contact within 30 days. This kind of threshold helps programs identify disengaged participants before they are officially classified as lost to follow-up.
Once "active" is clearly defined, you’re ready to move on to the retention rate formula.
Retention Rate Formula and Steps
The formula to calculate retention rates is straightforward: (Participants Active at Target Date / Total Enrolled) × 100. Here's how to apply it step-by-step:
- Define your cohort: For example, participants who enrolled in August 2023.
- Set your retention milestone: This could be 30 days, 90 days, or another specific timeframe.
- Count active participants: Determine how many from the cohort remain active at the target date.
- Calculate the retention rate: Divide the number of active participants by the total enrolled, then multiply by 100.
For instance, an analysis at Urban Addiction Treatment revealed critical drop-off points: 45% of participants disengaged between the initial call and assessment, 32% between assessment and enrollment, and 37% within the first 30 days. Breaking down the process like this can pinpoint where participants are most likely to drop out.
Using Recovery Center CRM for Automated Calculations
Tracking retention manually with spreadsheets can be tedious and prone to errors. That’s where Recovery Center CRM comes in. This platform automates retention calculations by pulling data from billing records and session logs. It flags participants who haven’t had a billable contact in over 30 days, allowing your team to act before they officially disengage.
The system also tracks cohorts automatically, letting you view retention rates at intervals like 30, 60, and 90 days without the hassle of manual counting. You can even break down the data by demographics, referral sources, or program types to identify patterns in participant drop-off. By automating these processes, Recovery Center CRM not only saves time but also ensures your retention metrics are accurate and up-to-date for state reporting.
Interpreting Retention Rate Results
Understanding retention rates is essential for pinpointing where engagement efforts may be falling short and identifying opportunities for improvement.
Understanding Benchmarks and Attrition Rates
Once you’ve calculated retention rates, the next step is to interpret what those figures mean. Studies indicate that completing at least 90 days of treatment is associated with better outcomes, such as reduced substance use, fewer interactions with the criminal justice system, and improved housing stability. For this reason, the 90-day mark is often considered a key indicator of program success.
However, retention data reveals a common challenge: 75% to 80% of individuals seeking treatment drop out between the initial call and the end of the first 30 days. These early drop-offs highlight critical moments where engagement strategies need to be strengthened.
A useful benchmark comes from Washington State, which set specific goals for 90-day outpatient retention: increasing rates from 67% to 70.7% for adults and from 71% to 73.8% for adolescents. These targets represent realistic improvements while acknowledging the inherent difficulties of retention. If your program’s 90-day retention rate is below 67%, it’s a clear signal to reassess and intervene.
Segmenting Data by Time Periods and Demographics
Retention numbers alone don’t tell the full story. Breaking down data into specific segments can uncover actionable patterns. Start by analyzing retention rates across key time intervals, such as the first 24 to 48 hours after initial contact, the first 30 days, and the 90-day milestone. Research shows that the first two days are especially critical, as attrition rates spike during this period.
Demographic segmentation adds another layer of insight. For instance, data often shows that women are less likely than men to complete the first 30 days of treatment, suggesting a need for gender-specific support. Similarly, analyzing retention by referral source - whether participants come through courts, hospitals, or self-referral - can help identify which pathways yield the most engaged participants. Another key factor is wait time: individuals offered same-day assessments are 2.5 times more likely to attend compared to those waiting 3 to 7 days.
These insights help refine engagement strategies and ensure interventions are tailored to specific needs.
Leveraging State-Level Impact Analytics
For programs serving state-funded populations or operating across multiple locations, looking at retention data from a broader perspective is essential. Recovery Center CRM’s State-Level Impact Analytics simplifies this process by consolidating retention data across your network. It automatically generates high-level reports required for federal grant compliance and legislative budget reviews. The system organizes data by program type, demographics, and region, enabling you to benchmark performance and identify areas with higher retention rates.
This aggregated data doesn’t just meet compliance needs - it also highlights trends that individual program reports might overlook. For example, you can pinpoint regions with consistently strong 90-day retention rates and investigate the practices contributing to their success. Recovery Center CRM also ensures data security through HIPAA and SOC 2 compliance, allowing for safe data sharing across agencies like courts, health departments, and housing providers. With role-based permissions, you can maintain participant privacy while using the data to drive public health improvements.
Identifying Trends and Drop-Off Points
Segmenting Data by Program Type and Referral Source
Breaking down retention data by program type can highlight where engagement issues lie. Residential programs and outpatient services often face different hurdles, with factors like wait times and completion rates varying significantly. For example, individuals referred through the criminal justice system often display retention patterns distinct from those who self-refer or are referred through hospital emergency departments.
A study conducted at Urban Addiction Treatment in Illinois uncovered an alarming 80% overall attrition rate. Median wait times were 6 days for assessments and 8 days for enrollment, prompting a complete overhaul of their intake process.
Looking at data through the lens of referral sources provides another layer of insight. Research indicates that referral source plays a more significant role in retention as treatment progresses. Court-referred individuals often have external accountability, which can help them stay engaged longer. On the other hand, self-referred participants may disengage more quickly if they don't see immediate results. Monitoring these trends helps allocate resources to areas where they can have the greatest impact.
Using Cohort Analysis to Spot Patterns
Cohort analysis follows a specific group of individuals from their initial contact through each stage of recovery. This method makes it easier to identify the stages where participants are most likely to drop out. Typically, these stages include the Initial Request for Services (IRS), assessment, enrollment, and treatment completion, with wait times measured in days between each milestone.
The data consistently reveals two key phases of attrition: a sharp drop-off within the first 24 to 48 hours after the initial request, followed by smaller, incremental losses for each additional day of waiting. For instance, individuals with same-day access to assessments are 2.5 times more likely to attend compared to those who wait 3 to 7 days. Cohort analysis also uncovers demographic differences - some studies suggest women are less likely to complete the first 30 days of treatment compared to men (OR = 0.73).
| Enrollment Stage | Attrition Rate (Weighted Mean) | Typical Wait Time (Median) |
|---|---|---|
| Initial Request to Assessment | 45% - 46% | 6 - 8 Days |
| Assessment to Enrollment | 32% - 44% | 8 Days |
| First 30 Days of Treatment | 29% - 37% | N/A |
| Overall Pipeline Loss | ~80% | N/A |
Source: Loveland & Driscoll Case Study, 2014
With these insights, automated tools can now track and analyze these metrics efficiently.
Tracking Metrics with Recovery Center CRM
Recovery Center CRM simplifies the process of monitoring the metrics that matter most to your program. By centralizing demographic data, referral sources, and wait times between stages, the platform eliminates the need for manual data compilation. This makes it easier to spot trends and address problem areas.
For programs handling Justice-to-Community transitions, the system tracks the "Warm Handoff" process, ensuring individuals moving from incarceration to community-based care don't get lost during the transition. The Intake & Referral Hub focuses on "time-to-care" metrics for court-referred participants, which are directly tied to retention outcomes.
Recovery Housing networks benefit from tracking tools that monitor bed availability, move-in dates, and housing stability - key factors that influence long-term retention. Automated workflows also play a critical role, scheduling follow-ups based on daily reports and prioritizing individuals showing early signs of disengagement. This ensures that no one is overlooked, especially during the crucial first 48 hours after their initial request for services.
Strategies to Improve Retention Rates Using Analytics
Addressing High Drop-Off Stages with Interventions
One of the most effective ways to tackle high drop-off rates is by reducing the wait time between an individual’s initial request for services and their assessment. Research from Urban Addiction Treatment revealed that 45% of people never progressed from their first phone call to the assessment stage.
"Individuals who had same-day access to the assessment after making an IRS were two and half times more likely to show, on average, compared to individuals assigned an appointment that was 3 to 7 days from the IRS." - David Loveland, Human Service Center
Another impactful approach is adopting treatment models that lower barriers to entry. The American Society of Addiction Medicine (ASAM) advises against requiring abstinence as a prerequisite for starting or continuing treatment. For individuals involved in the justice system, initiating Medication-Assisted Treatment (MAT) before release has been shown to significantly improve retention rates once they re-enter their communities. Additionally, when someone misses an appointment, quick re-engagement efforts - such as follow-up calls or messages - can help reconnect them to care before they fully disengage. These timely interventions set the stage for automated outreach systems that can handle such tasks efficiently.
Leveraging Automated Workflows for Consistent Outreach
Relying on manual follow-ups often leaves gaps, particularly for individuals at higher risk of disengagement. This is where Recovery Center CRM steps in, automating critical touchpoints to keep participants engaged during vulnerable periods. The platform generates daily reports that prioritize follow-ups based on specific risk factors, ensuring that individuals showing early signs of disengagement receive immediate attention - especially within the crucial first 24 to 48 hours of their initial request.
Automated appointment reminders help reduce no-show rates, while scheduled check-ins at key milestones, such as 30 and 90 days, prompt proactive interventions. These touchpoints are vital, as remaining in treatment for at least 90 days is strongly linked to positive outcomes, including reduced involvement with the criminal justice system and improved housing stability. The system also flags missed appointments in real time, allowing staff to reach out quickly before disengagement becomes permanent. By automating these processes, programs can maintain consistent engagement and support individuals in their recovery journey.
Comparing Common Retention Strategies
Using analytics to guide interventions allows programs to evaluate and refine their retention strategies for maximum impact.
| Strategy | Effectiveness | Implementation Notes |
|---|---|---|
| Same-Day Access | 2.5x higher show rate | Most effective for early drop-offs; requires streamlined intake processes |
| Contingency Management | Effective with antagonist MAT | Resource-heavy; may face policy or funding challenges |
| Extended-Release Medications | Comparable to daily formulations | Convenient but offers no retention advantage over daily doses |
| Psychosocial Support | Mixed/Limited evidence | Hard to measure impact when combined with other treatments |
While contingency management shows strong results when paired with antagonist MAT, it can be difficult to implement due to resource limitations. Similarly, extended-release medications provide convenience but don’t necessarily improve retention compared to daily formulations. The key is to align specific interventions with the drop-off points identified through your analytics, tailoring strategies to address the unique needs of your program and participants.
Conclusion and Key Takeaways
Retention rates serve as a clear indicator of a program’s success. Staying in treatment for 90 days is closely tied to reduced substance use, fewer interactions with the criminal justice system, and improved housing stability. Focusing on retention during evaluations uncovers where participants disengage, offering critical insights to pinpoint and address drop-off points.
Shifting from reactive to proactive management changes the game for recovery programs. Tools like Recovery Center CRM make it possible to personalize care by monitoring attendance and engagement. Research shows that this data-driven approach can improve recovery outcomes by up to 40%. The platform uses predictive algorithms to identify patients at risk of disengagement, such as those with irregular attendance or low participation in therapy. This allows staff to intervene early and provide timely support.
This proactive mindset becomes a guiding principle for decision-making. As Bivisee aptly stated:
"Analytics is the bridge between insight and action, ensuring every decision is guided by data, every patient feels supported, and every center achieves its full potential."
On a broader scale, these strategies lead to measurable program-wide improvements. Personalizing care with data has been shown to increase program completion rates from 65% to 85%, boost patient satisfaction from 70% to 92%, and lower relapse rates from 35% to 20%. By managing data integrity, compliance, and outreach, Recovery Center CRM frees up staff to focus on what truly matters - supporting patients on their recovery journey.
FAQs
What are the best ways to reduce dropout rates in the first 30 days of recovery programs?
Reducing dropout rates during the first 30 days of recovery programs hinges on creating strong early connections and providing consistent support. This period is often marked by challenges such as low motivation, weak support networks, or logistical hurdles, which can push individuals to leave prematurely. To counter these issues, programs can prioritize personalized outreach - leveraging methods like motivational interviewing - and ensure immediate access to critical resources such as peer support groups and counseling services.
Keeping the lines of communication open is equally important. Regular check-ins, whether through calls or text messages, can help clients feel valued and connected. Additionally, data-driven tools like case management platforms play a pivotal role in identifying individuals who may be at higher risk of dropping out. For example, platforms like Recovery Center CRM enable providers to monitor engagement, send automated reminders, and deliver tailored support. This combination of personalized care, proactive communication, and actionable insights equips recovery programs to boost retention rates and set the stage for long-term success.
How can automated tools like Recovery Center CRM improve retention tracking in recovery programs?
Automated platforms like Recovery Center CRM simplify retention tracking by consolidating essential recovery data in one place. This includes demographic details, appointment schedules, and interaction histories, making it easier to track individual progress, pinpoint drop-off points, and take timely action to keep participants engaged.
Beyond ensuring better accuracy, automation cuts down on tedious tasks like manual record-keeping and sending appointment reminders. This allows staff to dedicate more time to providing personalized care. The platform also offers valuable data insights and impact reports, helping recovery programs adjust their strategies based on measurable results. By streamlining these processes, Recovery Center CRM supports organizations in boosting retention rates and fostering long-term recovery outcomes.
Why is completing 90 days in a recovery program so important for success?
Completing 90 days in a recovery program is often considered a key achievement. Why? Research indicates that sticking with treatment for this duration is closely tied to better recovery outcomes. People who stay engaged for at least 90 days are more likely to maintain abstinence, reduce substance use, and experience overall success in their recovery journey.
This three-month period provides the time needed to develop healthier routines, tackle deep-seated issues, and learn essential coping strategies for long-term sobriety. Regular commitment during this phase greatly boosts the likelihood of making meaningful, lasting changes.