
How To Use Data To Predict Relapse Risk
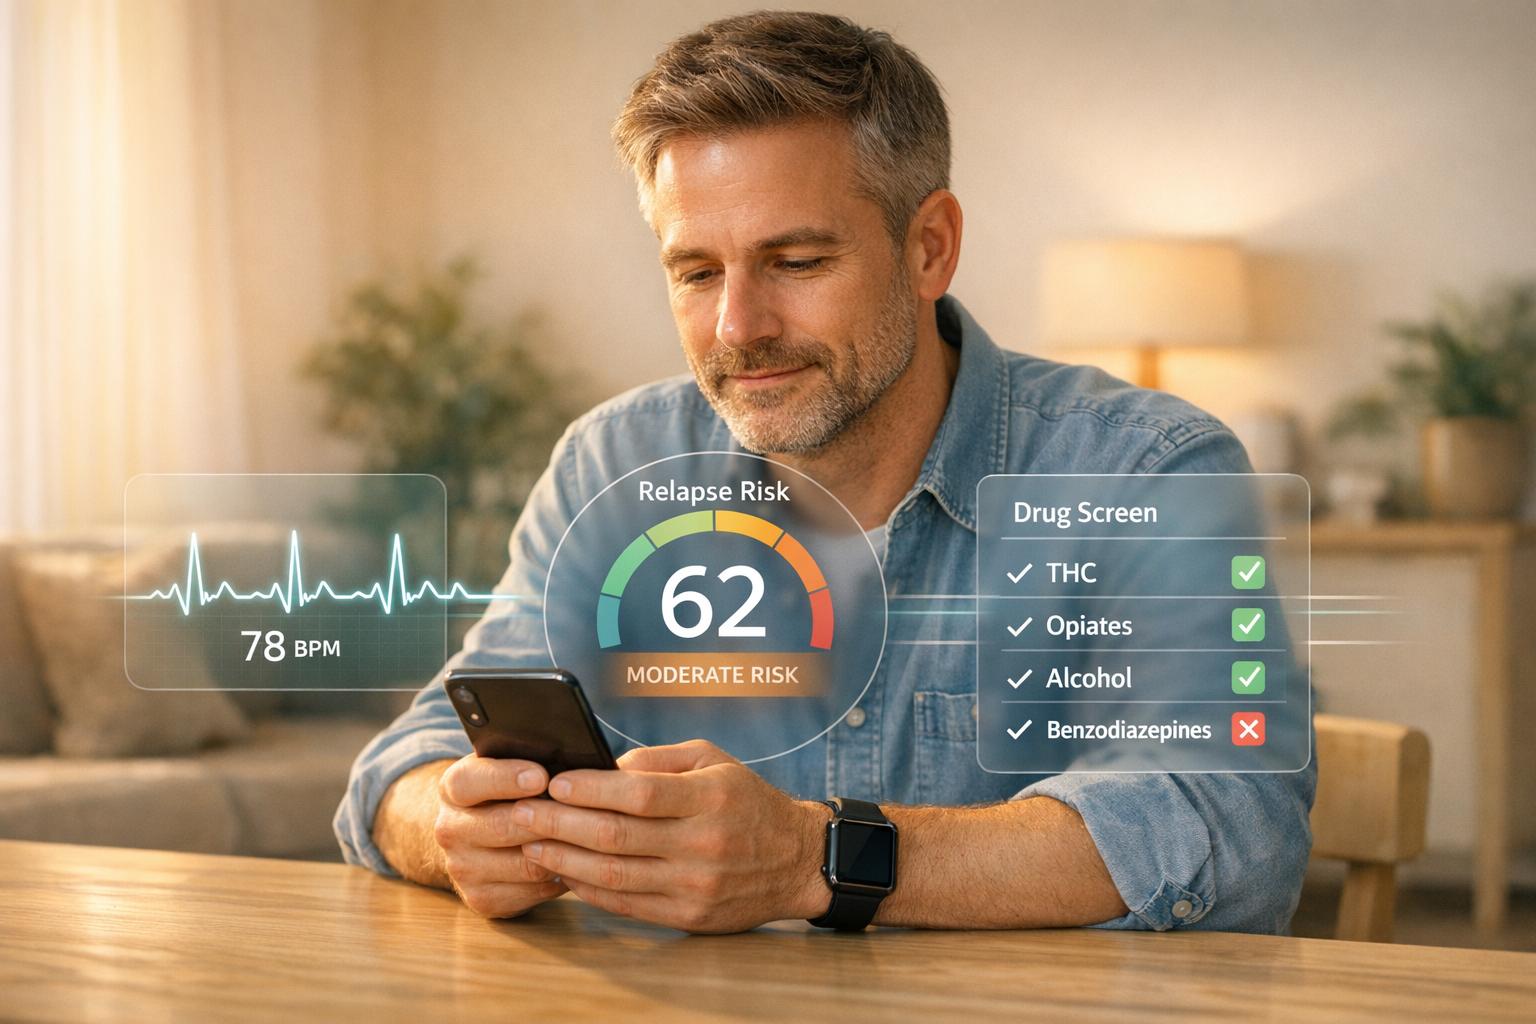
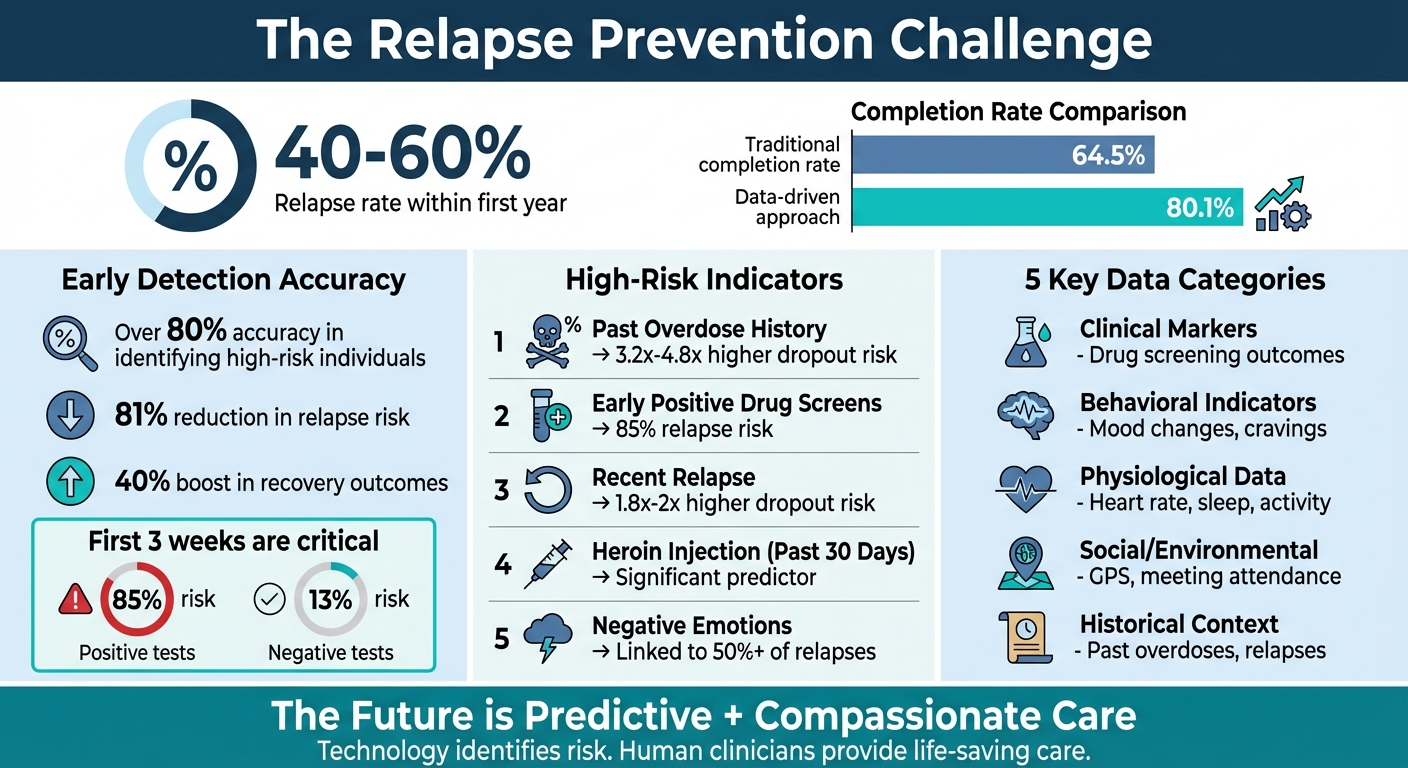
Relapse rates for addiction recovery are alarmingly high - 40-60% within the first year. But data analytics is changing how recovery centers approach prevention. By analyzing patterns from urine tests, wearable devices, therapy attendance, and even GPS data, professionals can identify subtle signs of relapse risk before it happens. Tools like Recovery Center CRM centralize this data, helping clinicians detect red flags like disrupted sleep, social withdrawal, or visits to high-risk locations.
Key Takeaways:
- Early Warning Signs: Negative emotions, cravings, and social withdrawal are common predictors.
- Predictive Power: Urine drug screens and wearable data can forecast relapse risk with high accuracy.
- Actionable Insights: Machine learning models create personalized risk scores, guiding early interventions.
- Real-Time Alerts: Systems track deviations from personal baselines and notify care teams instantly.
- Proven Results: Facilities using predictive analytics report an 80.1% treatment completion rate - far above the national average of 64.5%.
The future of recovery lies in combining advanced data tools with human care, enabling proactive, personalized support for those at risk.
Data-Driven Relapse Prevention: Key Statistics and Risk Factors
Using Data to Predict Relapse & Improve Rehab with Trac9 - DANG! Podcast with Todd Bridges Ep. 50
sbb-itb-ce23a48
Step 1: Collect and Centralize Your Data
To effectively predict and prevent relapses, you need a centralized and accessible system that brings together all critical data points. Without this, essential information - like intake forms, lab results, therapist notes, and external device data - remains scattered and disconnected, making it nearly impossible to identify meaningful patterns. Recovery centers must gather both static data (like demographics, medical history, and age at first use) and dynamic behavioral signals to build a foundation for actionable insights.
Key Data Points to Monitor
The most useful data for relapse prediction falls into five main categories:
- Clinical markers: Regular drug screening outcomes are a cornerstone of relapse prediction.
- Behavioral indicators: Changes in mood (irritability, anxiety, depression) and cravings can signal increased risk.
- Physiological data: Wearable devices provide insights into heart rate variability, sleep patterns, and activity levels - early indicators of stress.
- Social and environmental factors: GPS tracking can identify visits to high-risk areas tied to past substance use. Social signals, such as skipping support meetings or withdrawing from social interactions, are equally telling.
- Historical context: Past overdoses and previous relapse episodes offer valuable context. For example, the Houston Emergency Opioid Engagement System (HEROES) study from May 2021 found that individuals who had dropped out of treatment were 3.2 to 4.8 times more likely to have a history of overdoses.
By focusing on these metrics, recovery centers can detect patterns and intervene before a relapse occurs.
How Recovery Center CRM Streamlines Data Collection
Recovery Center CRM simplifies the complex task of consolidating data by integrating multiple sources into a single, easy-to-access timeline. During intake, the platform automatically captures demographic details and continues to track each individual’s recovery journey over time. Clinical results, self-reported surveys, and behavioral observations are all organized into one cohesive record.
The system also pulls in data from external sources, such as wearable devices, smartphone app logs, and lab results from drug screenings. This unified dashboard allows clinicians to spot subtle warning signs early, enabling timely interventions. By centralizing data, Recovery Center CRM ensures that professionals don’t have to sift through disconnected systems to piece together a client’s status. Instead, they gain a full, real-time picture of each individual’s progress, making it easier to address potential issues before they escalate. This seamless integration of technology, processes, and people transforms how recovery centers deliver care.
Step 2: Identify Relapse Risk Patterns
Once you've centralized the data, the next step is to dig into it and uncover clear patterns that signal relapse risks. Recognizing the gradual steps leading to a relapse is key to spotting subtle warning signs. These insights help transform raw information into early indicators that allow for timely intervention.
Analyze Behavioral and Mental Health Trends
Negative emotions like anger, anxiety, depression, and even boredom are linked to over 50% of relapse episodes. On top of that, interpersonal conflicts and social pressures can escalate the risk. But beyond these obvious triggers, it's important to notice smaller, less apparent signals - things like social withdrawal, unusual spending habits, or changes in how someone communicates.
A concept known as "Apparently Irrelevant Decisions" (AIDs) is particularly important here. These are minor choices that might seem harmless but can gradually lead someone closer to a high-risk situation. For instance, someone recovering from alcohol use might justify keeping a bottle of wine at home "just for guests", which could quietly set the stage for relapse. Another red flag is the "feeling better" paradox - when someone feels they’ve recovered too quickly, they may prematurely stop treatment, increasing their vulnerability.
The early weeks of treatment, especially the first three, offer critical predictive data. A study by the National Institute on Drug Abuse Clinical Trials Network involving 2,199 adults with opioid use disorder found that those with weekly opioid-negative urine drug screens during the first 21 days had just a 13% risk of relapse by week 12. In contrast, those with positive or missing test results faced an 85% risk.
Use CRM Analytics to Spot Patterns
Recovery Center CRM analytics take this a step further by identifying deviations from an individual's personal norms instead of comparing them to generic population averages. This personalized approach flags changes in behavior and generates actionable insights for the care team. The system monitors both risk factors - like depression, cravings, relationship struggles, and sleep disturbances - and protective factors, such as confidence, AA attendance, and time spent with supportive family members. Together, these data points create a real-time recovery progress score.
For alcohol-related relapses, the system highlights signs like disrupted sleep, missed work, and heightened stress levels. For drug-related relapses, it focuses on patterns like visits to high-risk locations, sudden financial changes, and physical markers such as weight loss or an increased resting heart rate. By combining information from urine drug screens, wearable devices, self-reported surveys, and behavioral observations, the Recovery Center CRM builds a detailed risk profile. This allows staff to intervene early, well before a relapse occurs. It’s a seamless way to turn raw data into actionable insights that can make a real difference.
Step 3: Build Risk Scoring Models
Transforming data patterns into predictive models allows for the creation of individual relapse risk scores. These models rely on machine learning algorithms to analyze multiple data streams - like demographics, clinical history, urine drug screens, and behavioral signals - all at once. The result? A probability score that estimates a person’s likelihood of relapse.
Create Predictive Models
To handle the complexity of addiction data, algorithms like Random Forest and XGBoost are particularly effective. For instance, between April 2010 and August 2011, researchers at the University of Wisconsin-Madison developed a Bayesian network model for the A-CHESS smartphone application. Using 2,934 weekly surveys from 152 individuals recovering from alcohol dependency, the researchers integrated variables such as "recovery progress" and "lapse history." The model achieved an impressive AUROC of 0.912 during external validation, and it proactively triggered support whenever a patient’s predicted lapse probability exceeded 5%.
Another powerful approach involves clustering techniques to group individuals with similar behavioral and physiological triggers, creating "relapse profiles." Additionally, mixed-effects models stand out for their ability to analyze longitudinal data. Instead of comparing a patient’s metrics to general population averages, these models evaluate changes against the individual’s own baseline. This personalized approach significantly boosts accuracy. For example, between 2006 and 2016, the National Institute on Drug Abuse Clinical Trials Network used data from 2,199 adults across three studies to develop the CTN-0094 OUD Return-to-Use Risk Score. Incorporating urine drug screen results from the first three weeks of treatment improved the model’s AUROC from 0.67 to 0.82.
Platforms like Recovery Center CRM simplify the integration of these predictive models. Recovery centers can generate individualized risk scores without needing a specialized data science team. The system updates risk calculations in real time as new data - whether from drug screens, self-reported surveys, or wearable devices - flows in. This ensures care teams always have up-to-date risk assessments, enabling them to focus on the most pressing concerns.
These models not only predict relapse risk but also highlight which factors demand immediate attention for intervention.
High-Risk Indicators and Their Impact
Not all risk factors are created equal. Some have a much stronger influence on relapse odds, making it critical to understand and prioritize them. The table below outlines key risk factors and their associated impacts:
| Risk Factor | Impact on Relapse/Dropout Odds | Context |
|---|---|---|
| Past Overdose History | 3.2x – 4.8x higher dropout risk | Individuals with a history of overdose face significantly elevated risks |
| Early Positive UDS (Weeks 1-3) | 85% risk vs. 13% with negative results | The first three weeks of treatment are crucial predictors |
| Recent Relapse | 1.8x – 2x higher dropout risk | Recent setbacks strongly indicate future disengagement |
| Heroin Injection (Past 30 Days) | Significant predictor of return to use | Active injection drug use within the past month |
| Quality of Life Improvement | 94% of early dropouts reported improvement | Paradoxically, feeling "too good too soon" increases risk |
| Craving Intensity & Stress | High impact on next-hour lapse prediction | Dynamic factors with immediate predictive power |
In May 2021, the Houston Emergency Opioid Engagement System (HEROES) at the University of Texas Health Science Center at Houston developed a machine learning model using data from 715 participants. The team employed a Random Forest classifier that achieved a sensitivity of 0.81 and specificity of 0.65 for predicting 90-day dropout. As Gottlieb explained:
A predictive model may be developed with a greater understanding of the factors that influence patient participation choices. The model allows for a system of classification; therefore, resources can be allocated efficiently.
To build effective models, it’s important to account for both static factors (like age, employment status, and addiction severity) and dynamic factors (such as craving intensity, sleep quality, and stress levels). While static factors provide a baseline risk profile, dynamic factors - especially when monitored in real time through wearables or daily check-ins - offer actionable insights that can guide immediate interventions.
Step 4: Set Up Alerts and Interventions
Once predictive models are in place, the next step is to create automated systems that respond in real time to prevent relapse.
Configure Alerts for High-Risk Patterns
Alerts work by tracking personal baselines - like sleep patterns, response times, stress levels, and meeting attendance - and flagging any significant deviations. They’re designed to pick up on subtle warning signs that might otherwise go unnoticed. For instance, a slight change in weekend communication habits combined with irregular support group participation might seem minor individually, but together, they can signal an increased risk. Systems also monitor deviation velocity, or how quickly these changes occur, as rapid shifts may indicate an impending crisis.
Researchers have already developed models that use smartphone sensors and natural language processing to predict opioid lapses in real time. These forecasts are shared with care providers, enabling them to take action through stepped care interventions.
For example, Recovery Center CRM makes it easier for teams to configure threshold alerts that activate when clinical scores - like depression or craving levels - exceed predefined limits for a specific treatment week.
| Data Source for Alerts | Risk Indicators Monitored | Real-Time Action |
|---|---|---|
| Smartphone Sensors | GPS (location), microphone (tone), camera (facial expressions) | Immediate clinician alerts |
| Digital Language | Social media posts, text message length/sentiment | Early warnings for therapists to adjust care |
| Clinical Assessments | Craving intensity, self-control scores, depression levels | Automated treatment recommendations |
| Wearable Devices | Sleep quality, heart rate variability, activity levels | Alerts for emotional or physical distress |
With these alerts in place, the focus shifts to ensuring that timely, personalized interventions are ready to follow.
Design Personalized Intervention Workflows
Alerts alone aren’t enough - they need to be tied to immediate, actionable responses. The most effective systems connect specific risk patterns to tailored intervention workflows, ensuring that the right steps are taken without delay.
In 2025, the Trac9 Informatics Program introduced a "Therapeutic Co-pilot" that generated real-time Predictive AMA Alerts for clients at high risk of leaving treatment against medical advice. When a high-risk client was flagged, the system provided an Intervention Guide with actionable steps, such as stress-reduction exercises like deep breathing or progressive muscle relaxation.
Recovery Center CRM takes this a step further by automating intervention workflows. For example, when a high-risk alert is triggered, the platform can initiate emergency sessions, schedule outreach calls, or provide guided prompts for clinicians to reduce relapse risks. For clients flagged by predictive AMA algorithms, it can activate specific protocols to prevent them from leaving treatment and notify the clinical director.
Facilities using these automated systems have seen a 24% higher treatment completion rate compared to the national average (80.1% versus 64.5%).
As the Canadian Centre for Addictions explains:
The algorithm provides the warning. Human clinicians provide the care that makes the difference.
While technology excels at identifying risks, it’s the immediate and compassionate response from care providers that ultimately safeguards recovery.
Step 5: Monitor and Refine Your Predictions
After centralizing data and identifying patterns, the next step is to consistently monitor and refine predictive models. This ensures that these models stay aligned with each individual's recovery progress. As recovery centers collect more data, patterns become clearer, and models adjust to reflect unique behaviors and triggers. This transforms initial predictions into tools for precise interventions.
Use Long-Term Data to Improve Models
The best predictive models grow more accurate by learning from real-world outcomes. When recovery centers track participants over an extended period, they can pinpoint which early indicators are truly linked to success or relapse. For instance, between 2018 and May 2021, the Houston Emergency Opioid Engagement System (HEROES) analyzed data from more than 700 participants to predict program dropout. Over time, the model's sensitivity improved - rising from 0.81 at 90 days to 0.86 at 120 days - showing how continued tracking enhances accuracy.
One standout finding is the importance of the first three weeks of treatment. Research involving 2,199 adults across three National Institute on Drug Abuse clinical trials (2006–2016) revealed that incorporating urine drug screen (UDS) results from the initial 21 days significantly boosted prediction accuracy. The model's area under the receiver operating characteristic curve (AUROC) increased from 0.67 to 0.82.
Long-term tracking can also uncover unexpected trends. For example, in the HEROES program, 94% of individuals who dropped out reported improvements in their quality of life. This "feeling better" paradox, as explained by Assaf Gottlieb, showed that some patients prematurely believed they no longer needed intensive support. Tools like Recovery Center CRM assist teams in monitoring these subtle shifts by tracking behavioral trends, clinical assessments, and engagement metrics. This enables models to better identify early indicators that predict long-term stability.
Once predictive models are fine-tuned through long-term tracking, the next step is presenting the results clearly and effectively.
Generate Impact Reports for Stakeholders
Refined data doesn’t just improve predictions - it also provides the foundation for compelling impact reports. These reports translate prediction outcomes into measurable metrics, such as treatment retention rates or reductions in hospitalizations, to demonstrate program success. For example, reports might showcase retention rates at key intervals (e.g., 85% at 90 days), lower hospitalization costs, or higher abstinence rates tied to data-driven interventions.
Platforms like Recovery Center CRM simplify this process by aggregating long-term data into reports that highlight how predictive models improve resource allocation. For example, they can show how peer coaching and connection was directed toward high-risk individuals while maintaining support for stable participants. These reports are particularly valuable for state-funded programs, as they provide evidence of improved outcomes that meet federal grant requirements and influence funding decisions.
One compelling example: recovery centers can demonstrate that individuals flagged by predictive algorithms received timely interventions, resulting in an 80.1% treatment completion rate - far above the national average of 64.5%. By continuously refining models and documenting their impact, recovery centers create a strong, data-backed case for long-term success and program expansion.
Conclusion: The Future of Data-Driven Relapse Prediction
The use of data analytics is reshaping how recovery centers approach relapse prevention. By centralizing data, spotting behavioral patterns, developing risk scoring models, automating alerts, and refining predictions over time, treatment providers can intervene early - long before the physical signs of a relapse emerge. Facilities leveraging predictive analytics boast an 80.1% treatment completion rate, significantly higher than the national average of 64.5%.
These advanced tools have led to remarkable results: an 81% reduction in relapse risk, a 40% boost in recovery outcomes, and AI models capable of identifying high-risk individuals with over 80% accuracy. This level of precision is transforming the care provided in recovery centers.
Platforms like Recovery Center CRM make it possible to implement these strategies at scale. By centralizing data from various sources, tracking long-term outcomes, and producing impact reports, the platform helps facilities demonstrate measurable success to stakeholders. With built-in HIPAA and SOC 2 compliance, it also lightens the administrative load, allowing clinical teams to focus on personalized care. This combination of technology and compassion highlights how innovation can enhance recovery efforts.
"AI should be seen as an enhancement, not a replacement, for traditional recovery methods. The best outcomes will likely come from a hybrid approach - blending AI technology with human support." – Dr. Bryan Borland, Redemption Recovery
Dr. Borland’s perspective underlines the importance of combining technological advancements with human empathy. The next step in this journey is multimodal data integration - bringing together biometrics, wearable tech, and continuous behavioral monitoring to create even more accurate predictive models. As these systems advance, recovery centers that embrace data-driven approaches will continue to see higher retention rates, fewer relapses, and improved long-term outcomes for those in their care.
FAQs
How can data analytics help predict and prevent relapse in addiction recovery?
Data analytics plays a key role in helping predict and prevent relapse during addiction recovery by spotting patterns that signal potential risks. With the help of machine learning and behavioral data, these predictive tools examine elements like patient history, engagement levels, and lifestyle changes. The goal? To identify early warning signs and address them before a relapse happens. This approach allows recovery centers to step in with targeted support or adjustments to treatment plans.
Take platforms like Bee Purple’s Recovery Center CRM, for example. They streamline this process by centralizing patient information, monitoring progress, and generating actionable insights. By using tools like these, recovery programs can offer tailored interventions and improve long-term success, ensuring individuals get the right care at the right time.
What data is most useful for predicting relapse risk?
Predicting the risk of relapse involves examining both static and dynamic information. Static data includes factors like demographic details, medical history, and initial clinical evaluations, which together create a baseline understanding of an individual’s risk.
On the other hand, dynamic data offers a closer look at ongoing changes. This could include behavioral patterns, updates from wearable devices, or noticeable shifts in speech and mood - factors that can reveal daily variations pointing to a heightened risk of relapse. With advancements like machine learning, these different types of data can now be combined. This integration boosts accuracy and helps recovery centers step in earlier, providing care that’s tailored to each person’s unique situation.
How can machine learning help predict the risk of relapse?
Machine learning plays a powerful role in predicting relapse risk by examining a mix of personal data, such as an individual’s history, behavioral trends, and real-time inputs from tools like wearable devices or electronic health records. These systems are trained on extensive datasets to detect intricate patterns and subtle warning signs - like shifts in behavior or physiological changes - that might signal a higher likelihood of relapse.
What makes this approach even more effective is its ability to evolve. By continuously incorporating fresh data, machine learning models generate personalized risk scores that adjust over time. This allows recovery centers to take proactive steps, like refining treatment strategies to meet a person’s unique needs. Tools such as Recovery Center CRM leverage these advanced analytics, giving clinicians and recovery teams the insights they need to deliver more precise, data-informed care.